Insercorp has released and deployed the new Website Traffic 3.0, restoring access to Google Analytics statistics in the iPlasmaCMS2 control panel. The new module simplifies statistics while providing enough relevant information for website administrators which are useful for marketing and statistical purposes for any and all organizations.

To access the new Website Traffic 3.0 dashboard, select “My Site” from your CMS Toolbar and click “Website Traffic”
Features Report
-
The Website Traffic Dashboard provides an overview of Website Statistics including Top Sources, Technology, Keywords, Pages, and Locations.
-
Select a Quick Report or generate reports using a Custom Date Range.
-
Visualize website traffic with colorful charts and graphs.
-
See how your audience is finding you with the Sources report.
-
Quickly see what pages are performing the best with the Content report.
-
Understand how your users connect to your website with the Technology report.
-
View dynamic maps and geographical statistics with the Locations report.
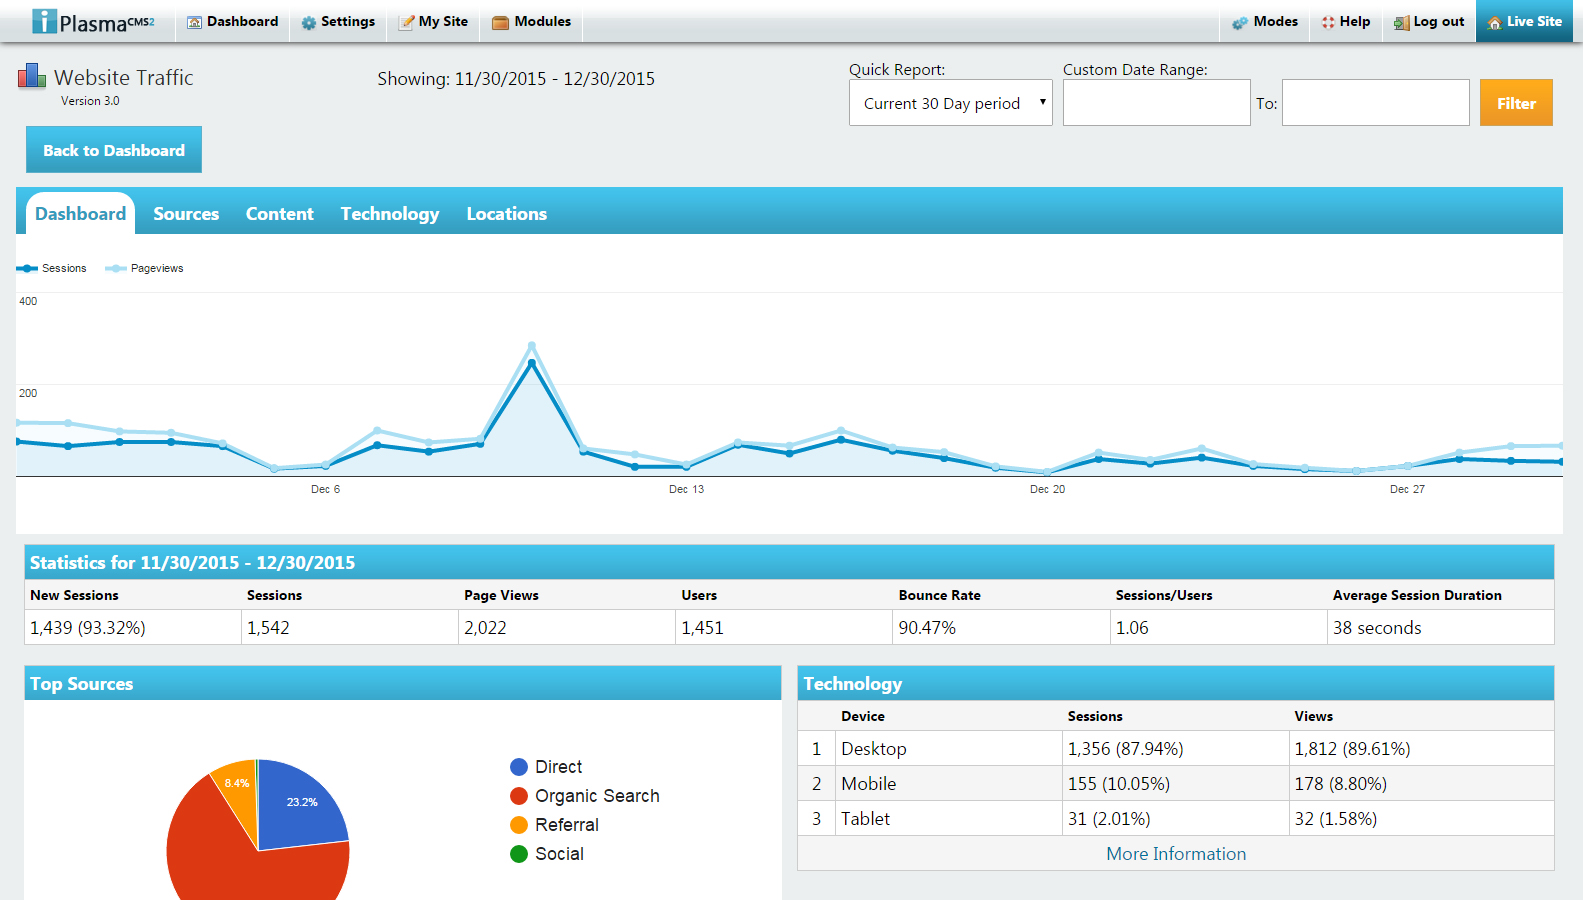
The Website Traffic Dashboard provides users with an intuitive interface to generate custom reports.
Sources Report
The Sources report provides website administrators with detailed information on where website traffic is coming from, including direct (users who typed the website address directly into their browser’s address bar), referrals, search engines, and social media.
-
Top Sources provides comparisons of all sources (Direct traffic is generated by users who type your website’s address directly into their browser’s address bar).
-
Referral provides a list of websites where users have clicked hyperlinks to connect to your website.
-
Search Engines provides a list of search engines which users have used to connect to your website.
-
Social Media provides a list of social media websites which users have used to connect to your website.
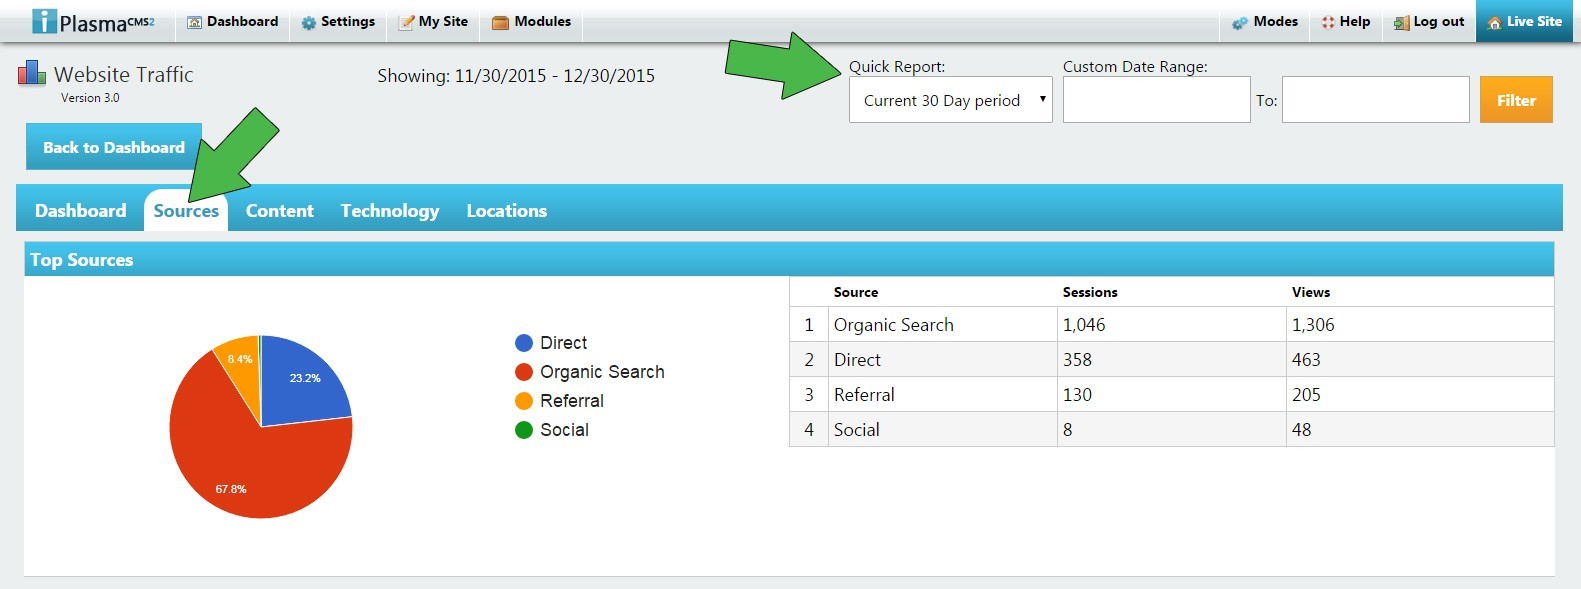 To view Sources Report select the “Sources” tab in the Website Traffic menu.
The statistics will show results based on the current Quick Report or Custom Date Range selected, which may be updated at anytime to manipulate results.
Content Report
To access this section, simply click the tab labeled “Content” as seen below. Next, choose a Quick Report or search a Custom Date Range.
-
Content is organized into four sections:
-
Top Pages provides you with the information displayed by Page, Sessions, and Views
-
Top Keywords provides information displayed by Keyword, Sessions, and Views
-
Top Landing Pages
-
Information displayed by Page, Sessions, and Views
-
Top Exit Pages
-
Information displayed by Page, Sessions, and Views
Technology Report
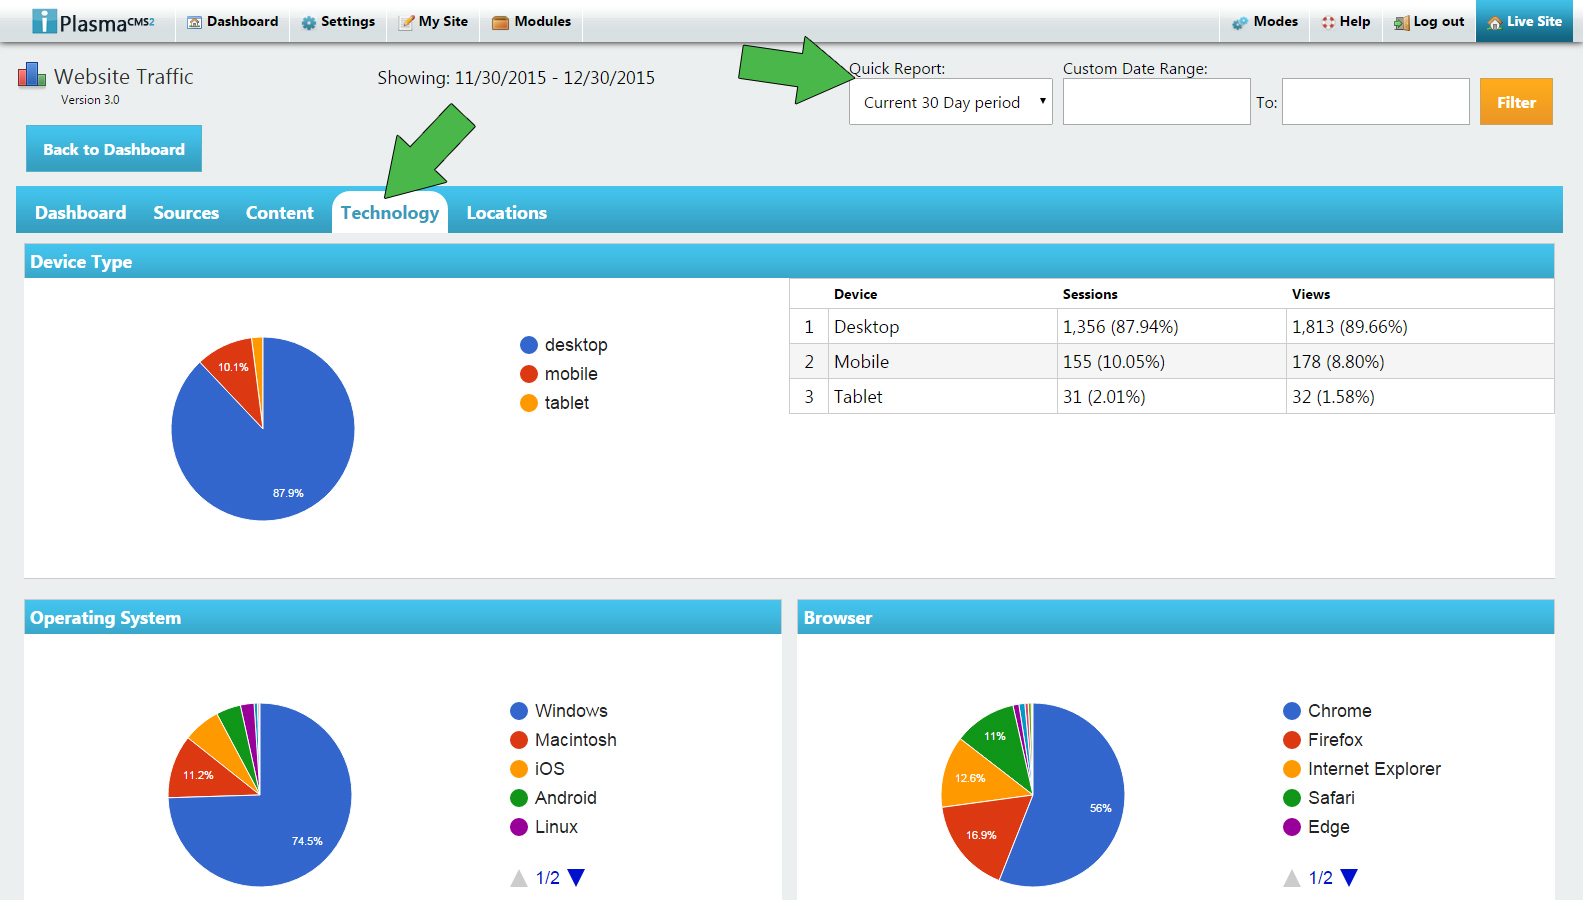
To access this section, simply click the tab labeled “Technology” as seen below. Next, choose a Quick Report or search a Custom Date Range.
-
The Technology tab provides you with the ability to view the Device Types, Operating Systems, and Browsers used to access your website.
-
Device Type:
-
Devices include Desktop, Mobile, and Tablet
-
It is organized by Device, Sessions, and Views
-
Operating System:
-
Operating Systems include Windows, Macintosh, iOS, Android, etc.
-
It is organized by OS, Sessions, and Views
-
Browser:
-
Browsers include Chrome, Firefox, Internet Explorer, Safari, etc.
-
It is organized by Browser, Sessions, and Views
-
Locations Report
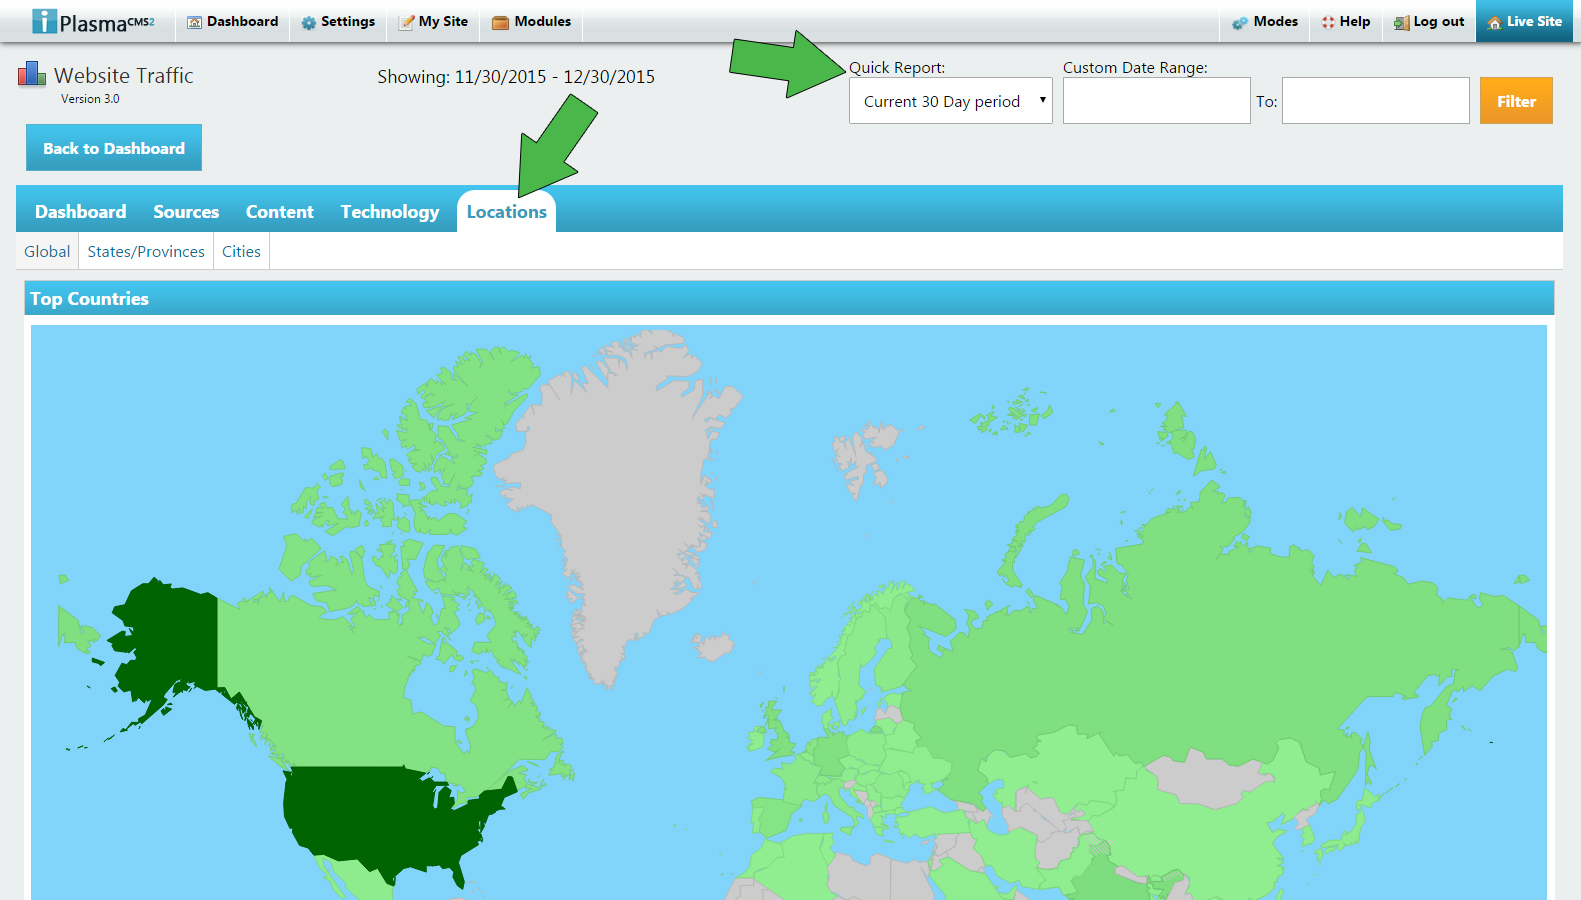
To access this section, simply click the tab labeled “Locations” as seen below. Next, choose a Quick Report or search a Custom Date Range.
-
The Locations tab is broken up into three sections - Global, State/Provinces, and Cities,
-
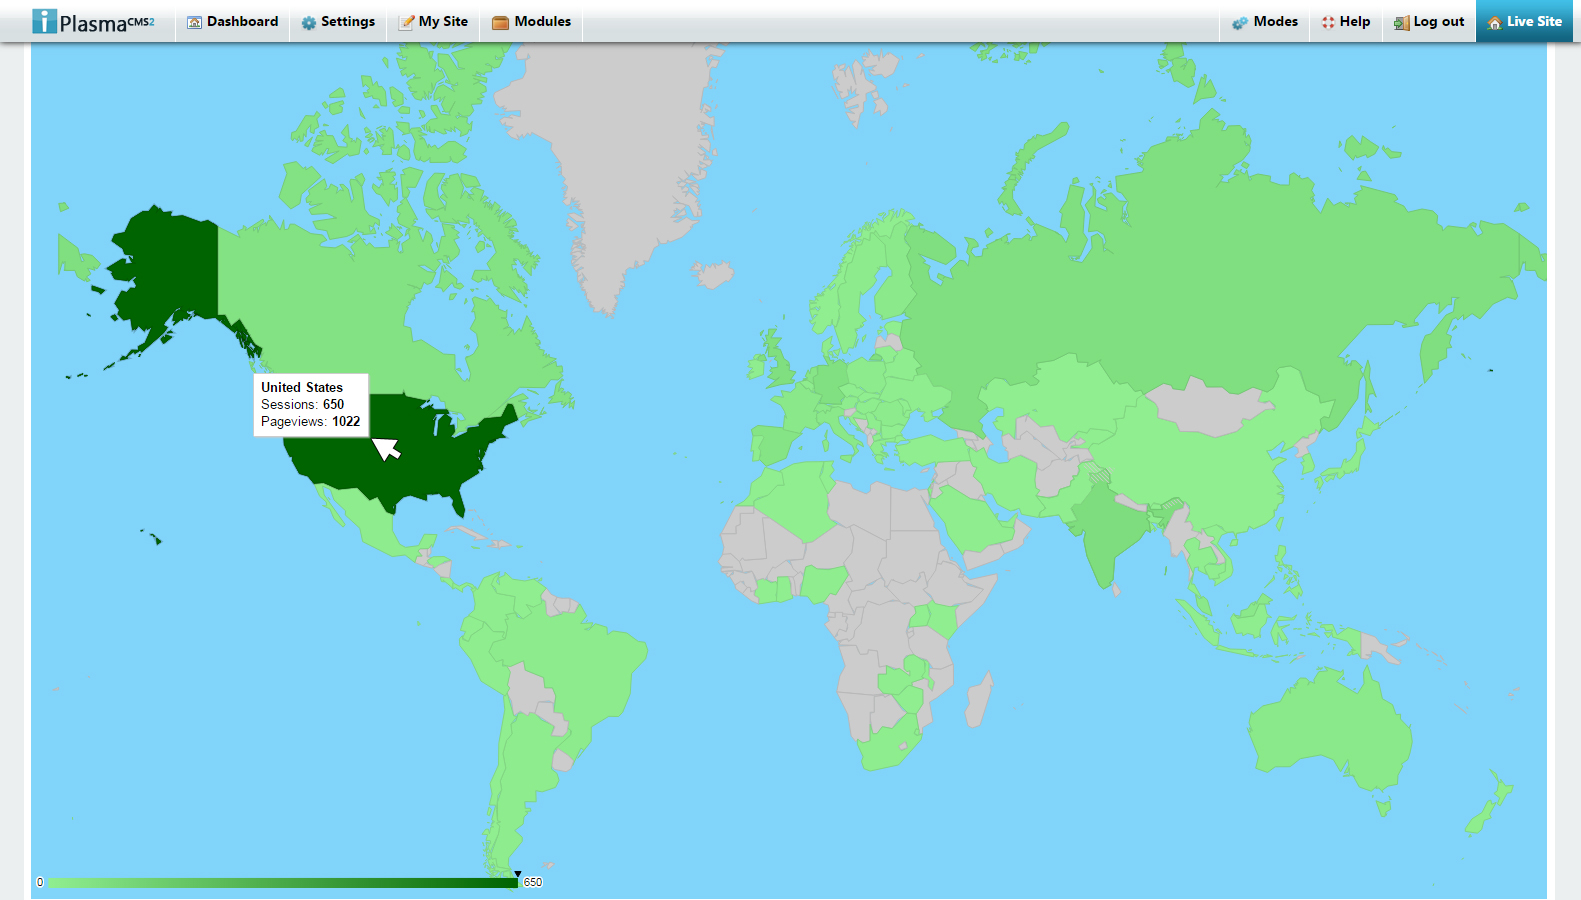
Global (pictured below):
-
Use your mouse cursor to hover over different Countries to view the number of Sessions and Page Views. (Note that the darker colored Countries are the ones with the most Sessions and Page Views)
Take Control of your Website with our Unique, Intuitive User Interface.
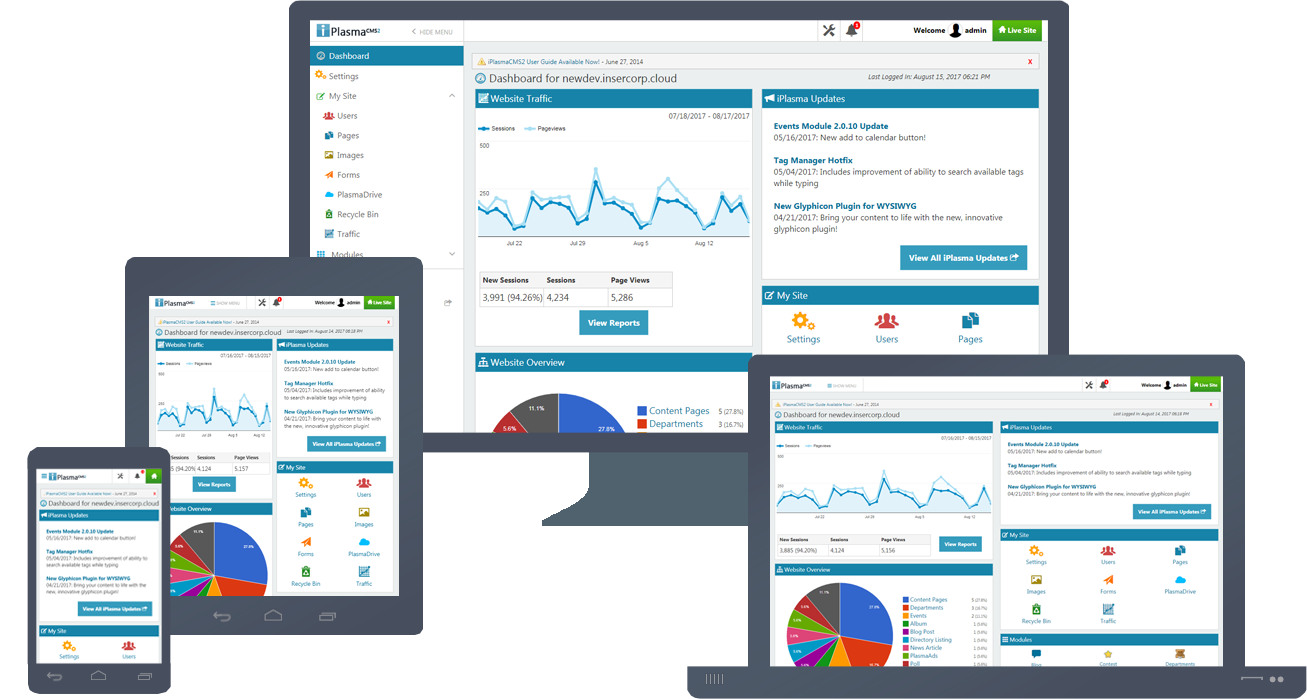
- Make instant updates from anywhere with Internet access.
- Easily build and manage unlimited pages with our Enterprise WYSIWYG Editor.
- Add or edit your Website on the go from iPlasma's mobile responsive control panel.
Grow your Web Presence with our Modular, Cloud-based Web Application.

- Enhance the capabilities of your website with customizable Modules.
- Save time and avoid redundant data management with dynamic Blocks.
- Integrate popular services with third-party API Integrations.
Keep your Website Secure and your visitors safe with Enterprise-grade Security.

- All Subscriptions include secure hosting and DNS management.
- Website Security features include DNSSEC, SSL certificates, firewalls, and more.
- Eliminate fears of data loss with automated daily backups and 24/7 monitoring.
Get More and Pay Less with Scalable Plans for any size Client or Project.

- Pay Annually or Monthly and pick the plan that's right for you.
- We manage your Web Operations with monitoring, support, and iPlasmaCMS updates.
- Scale as needed with VPS, Dedicated, or Cloud options for hassle-free Website Hosting.


 Made in the U.S.A.